 (This was going to be a much larger post, but I'm breaking it out into segments for easy digestability by people who know nothing about economics -- if you stick around for long enough, maybe there will be a funny story).
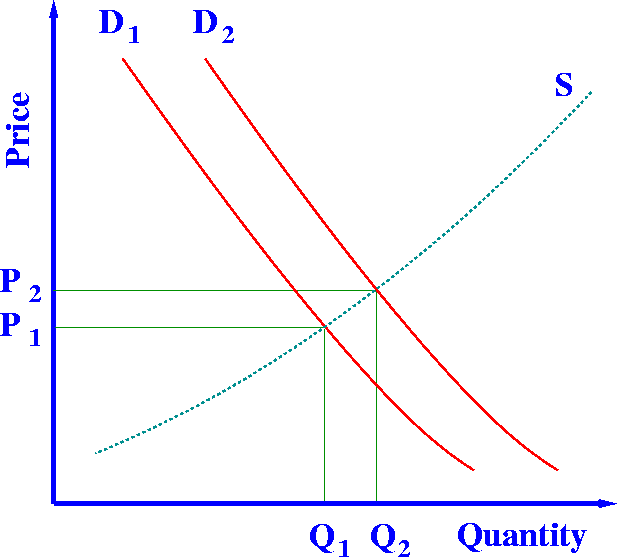
Look at the supply and demand curves to the left, see where they intersect? For now just look at the intersection of D1 and S, resulting in Q1 units of the good being sold.
What is demand, anyway?
Your demand for a good is the amount that you are willing to pay to have that good, also known as your reservation price. At the top of the line D1, we'll call it point A, if you draw a vertical line down to the Quantity axis you will find a Qa (use your imaginations kids!). If the price of the good were Pa, Qa people would be willing to buy it. You can also think of it as much benefit you get personally from buying thing x, if you buy a coffee for 1.50, it should make you 1.50-worth-of-happy to drink it (or spill it) and yes, there are huge problems with quantifying human happiness, sue me. If it makes you 3.00 worth of happy then you are one of those people more to the left on the demand graph.
What is supply, again?
Supply is the marginal cost to produce each product. How much does it cost the factory to go from producing 2 to producing 3 products. Sometimes this is also called a 'cost schedule'.
But doesn't it not cost anything to produce zero units? Shouldn't the supply curve go through the origin?
Yes, and no. If it doesn't cost anything to set everything up to make the very first product then yes, the curve should go through the origin. If you think that you need to buy some supplies and such, then it should start somewhere above the origin, like it does in the picture.
(More later)

No comments:
Post a Comment